Workforce Economics: Public Data and Semantic Modeling
A labor market, viewed through different instruments
What can employment, worker flows, and compensation tell us about the adjustment of the labor market? The first question is whether the statistical programs involved describe comparable populations and events.
This project uses publicly reported series from BLS CES, CPS, JOLTS, ECI, and Census QWI and J2J, with BED and BDS being incorporated into the broader model. A dashboard is a presentation layer over a source-aware measurement system, not a substitute for one.
Dashboard: employment and participation
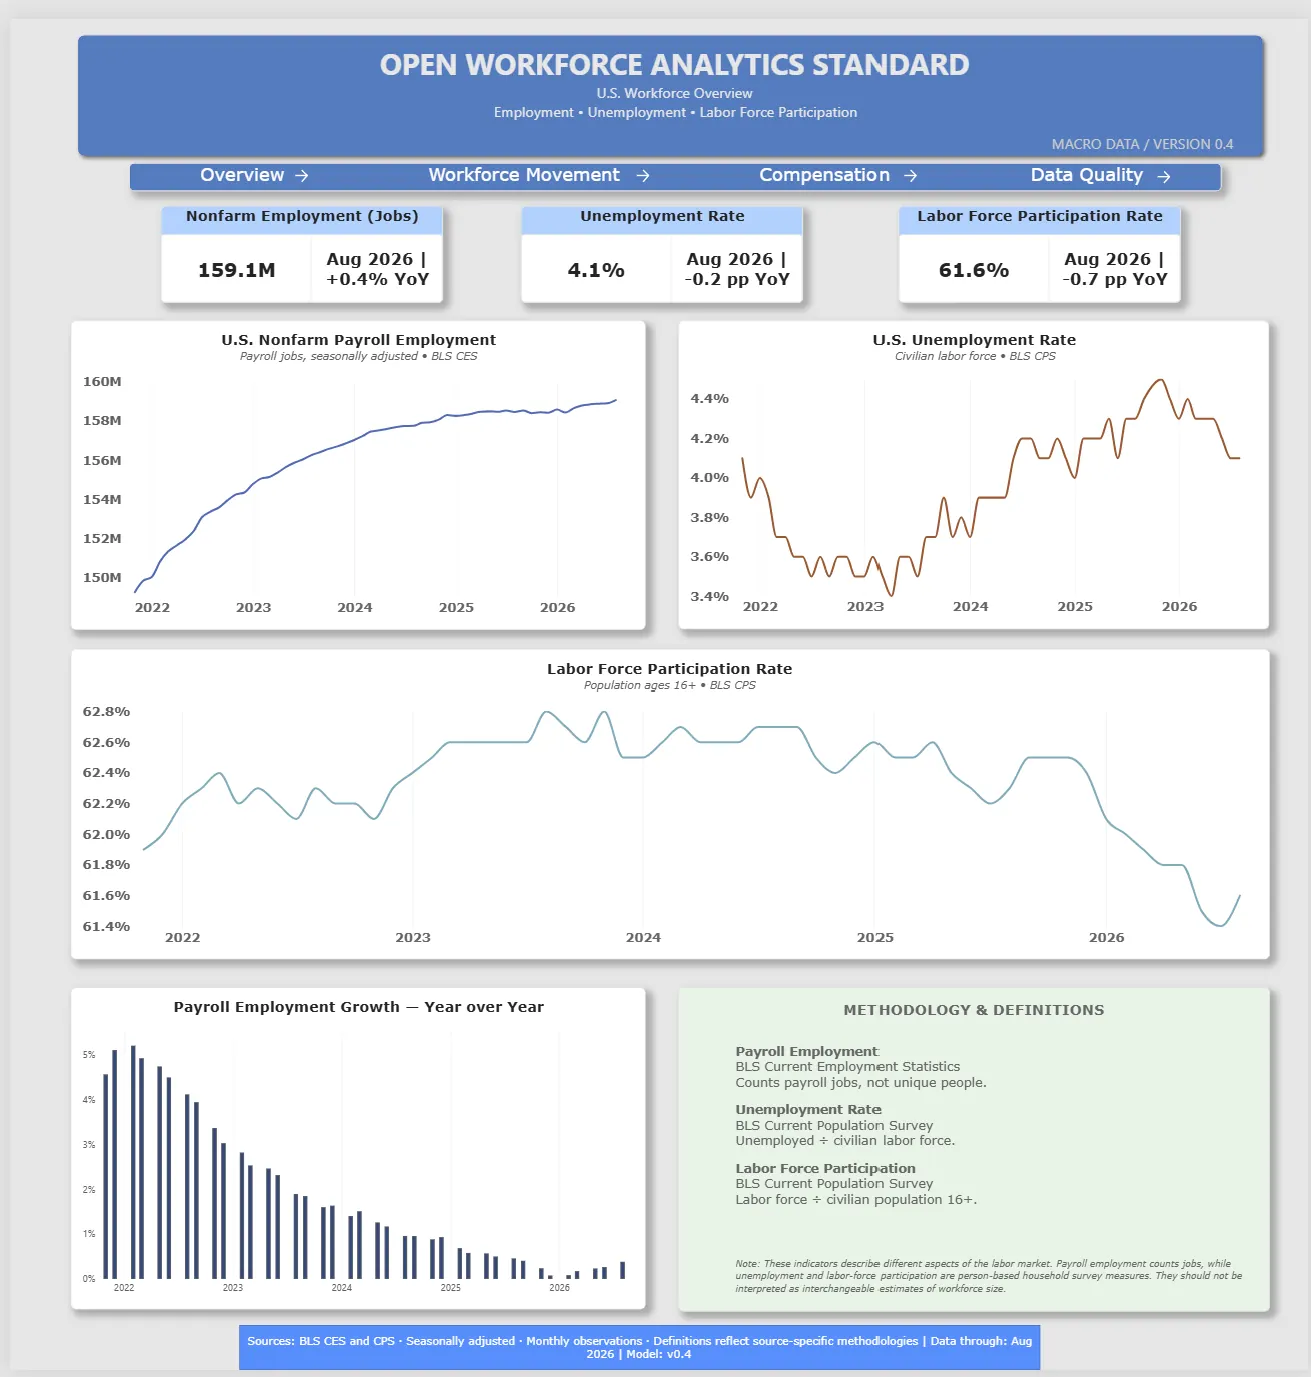
The overview pairs CES nonfarm payroll employment with CPS household-based labor-market measures. The distinction between jobs and people is essential: the charts answer related questions with different underlying universes.
Dashboard: worker flows
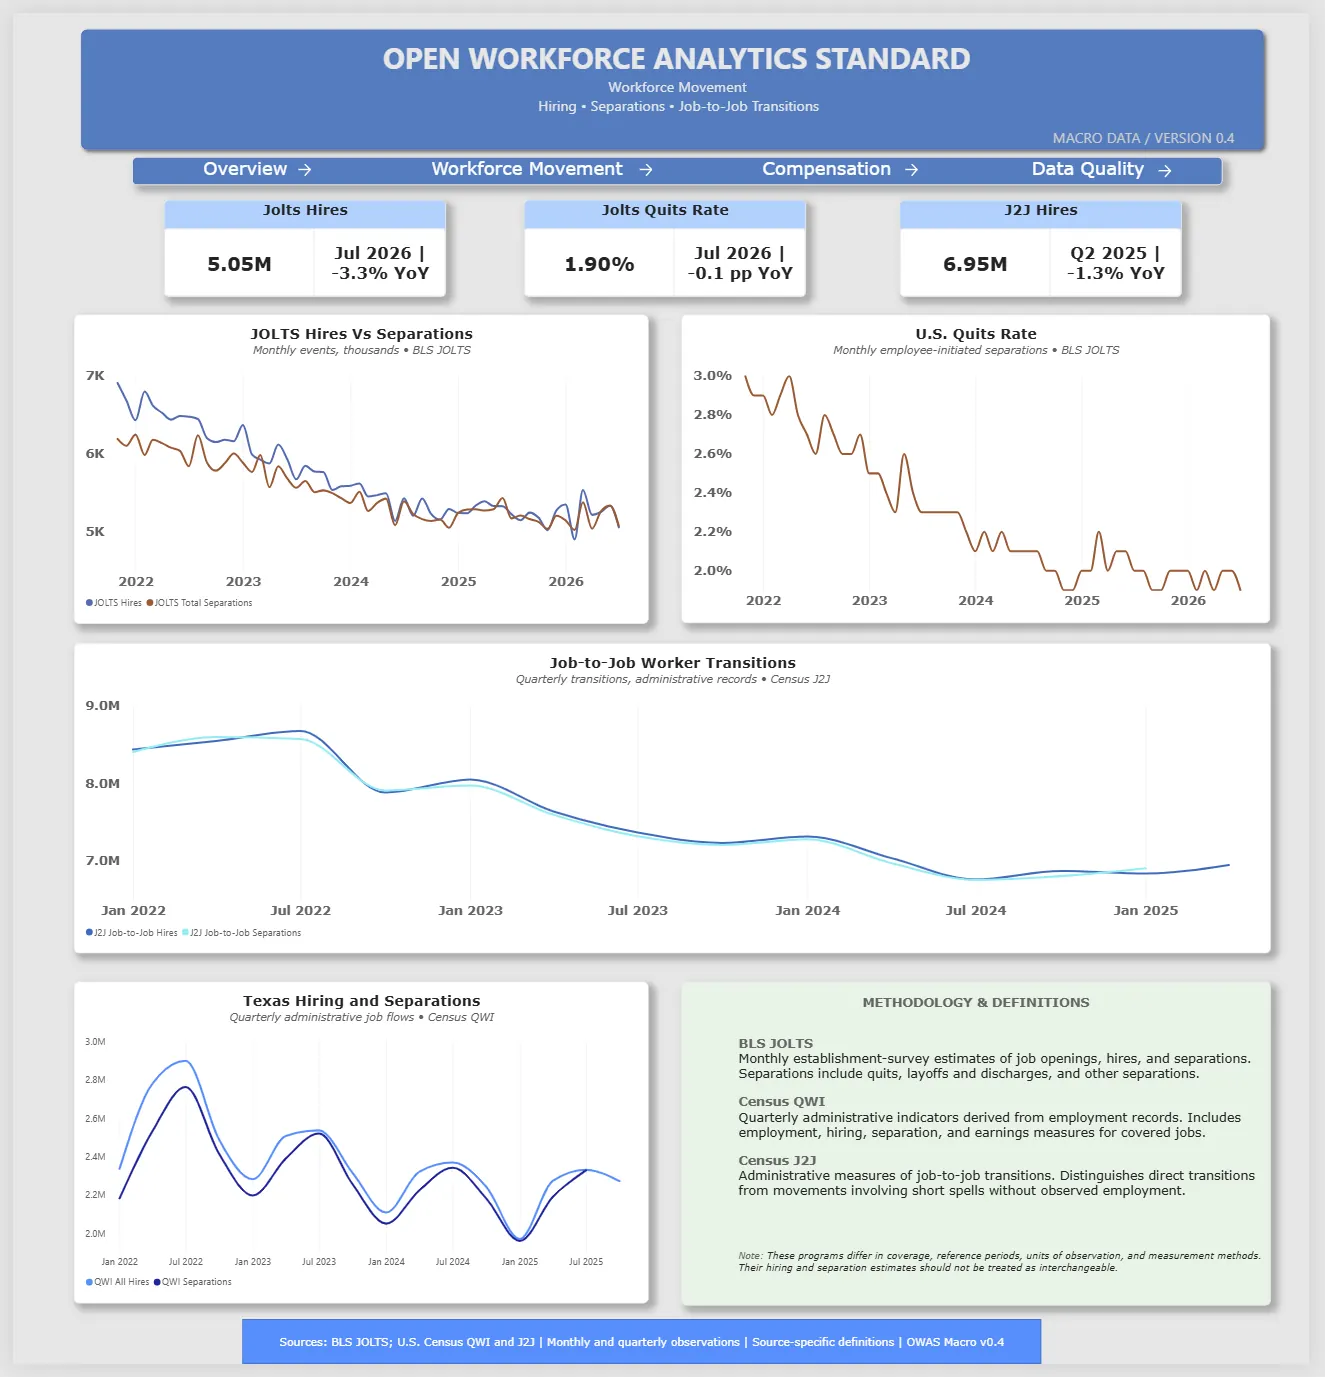
This view juxtaposes establishment-survey flows, job-to-job transitions, and Texas administrative job flows. Putting the series near each other is a prompt for analysis, not a claim that a count in one program can be equated to a count in another.
Dashboard: compensation
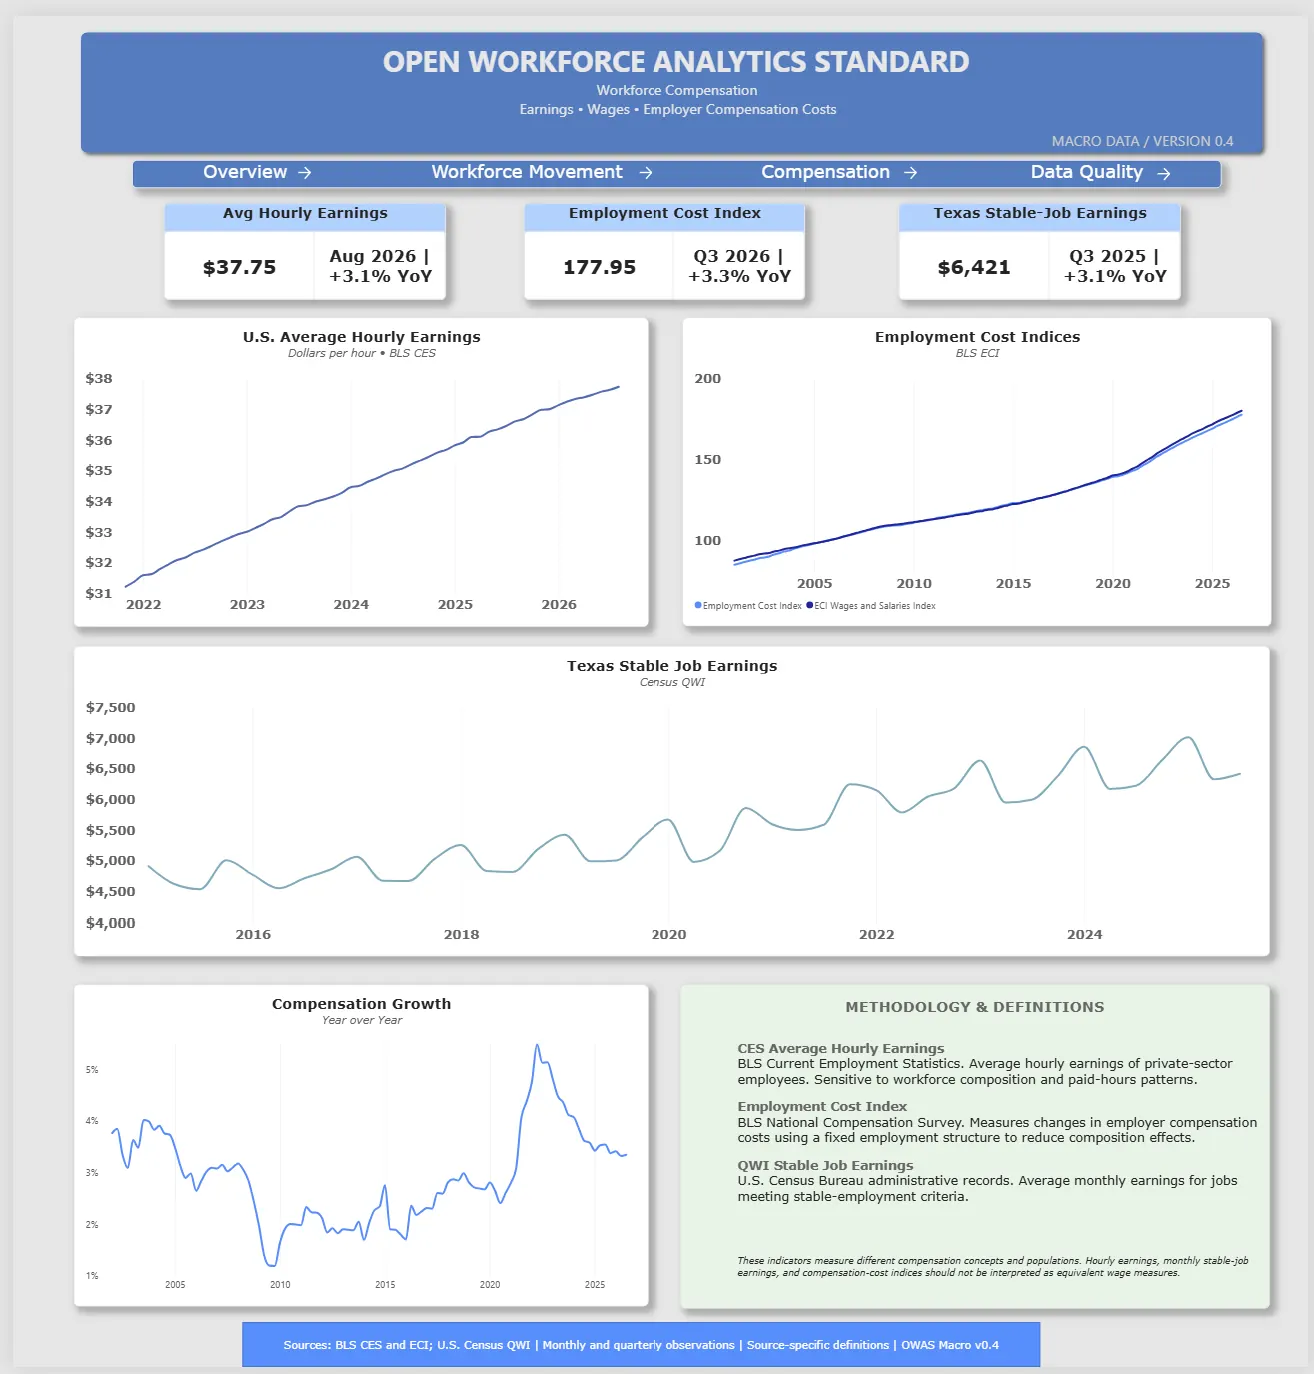
The compensation view brings together average hourly earnings, compensation cost indexes, and administrative stable-job earnings. Their different units and populations are precisely why the model retains measurement metadata.
Data engineering and modeling
The workflow uses R for ingest, cleaning, validation, and exports; Parquet for reusable outputs; and Power BI for dimensional relationships and reporting measures. Data-quality checks include missingness, time-period consistency, source metadata, and unit interpretation.
Interpretation and limitations
The screenshots are a development snapshot (v0.4), not a real-time economic release. Metrics may have different latest periods, vintage policies, seasonal-adjustment statuses, and geographic coverage. Apparent correlations do not establish firm-level mechanisms or causal relationships. Reproduction instructions and an updated technical diagram are planned.

Keegan Johnson
Applied Economist | Workforce Analytics & Data Science
Applied economics, enterprise workforce analytics, statistical modeling, and data engineering.