Estimating OBP with Empirical Bayes
Subtitle Render
## ── Attaching packages ─────────────────────────────────────── tidyverse 1.3.2 ──
## ✔ ggplot2 3.4.4     ✔ purrr   1.0.1
## ✔ tibble  3.1.8     ✔ dplyr   1.1.0
## ✔ tidyr   1.3.0     ✔ stringr 1.5.0
## ✔ readr   2.1.3     ✔ forcats 1.0.0
## Warning: package 'ggplot2' was built under R version 4.2.3
## ── Conflicts ────────────────────────────────────────── tidyverse_conflicts() ──
## ✖ dplyr::filter() masks stats::filter()
## ✖ dplyr::lag()    masks stats::lag()
## Warning: package 'odbc' was built under R version 4.2.3
## Warning: package 'fitdistrplus' was built under R version 4.2.3
## Loading required package: MASS
##
## Attaching package: 'MASS'
##
## The following object is masked from 'package:dplyr':
##
##     select
##
## Loading required package: survival
Connect to your database, or directly through an API like rbaseball.
db <- DBI::dbConnect(odbc::odbc(), "SQL")

# Connect without a DSN
db <- DBI::dbConnect(odbc::odbc(),
                     Driver = 'ODBC Driver 17 for SQL Server',
                     Server = 'LAPTOP',
                     Database = "saber",
                     trusted_connection = 'yes',
                     Port = 1433
                     )
Next select all at bats from the 2023 season.
df.ab_log <- DBI::dbGetQuery(db,"
                                 SELECT *
                                 FROM dbo.at_bat_log
                                 WHERE game_date > '2023-03-27'
                             ")

View(df.ab_log)
Now we’ll group players’ at bats and calculate their season OBP.
df.grouped <- df.ab_log |>
        group_by(matchup_batter_fullName) |>
        dplyr::summarize(num = sum(single, double, triple, home_run, walks,
                                   hit_by_pitch, intent_walks),
                         den = sum(at_bat, walks, hit_by_pitch, sac_fly),
                         ab_total = sum(at_bat)) |>
        mutate(obp = num / den) |>
        arrange(desc(obp))

# Totals are very slightly off, check hit types individually
plot_obp <- ggplot(df.grouped, aes(x=obp)) +
  geom_histogram() +
    theme_minimal()
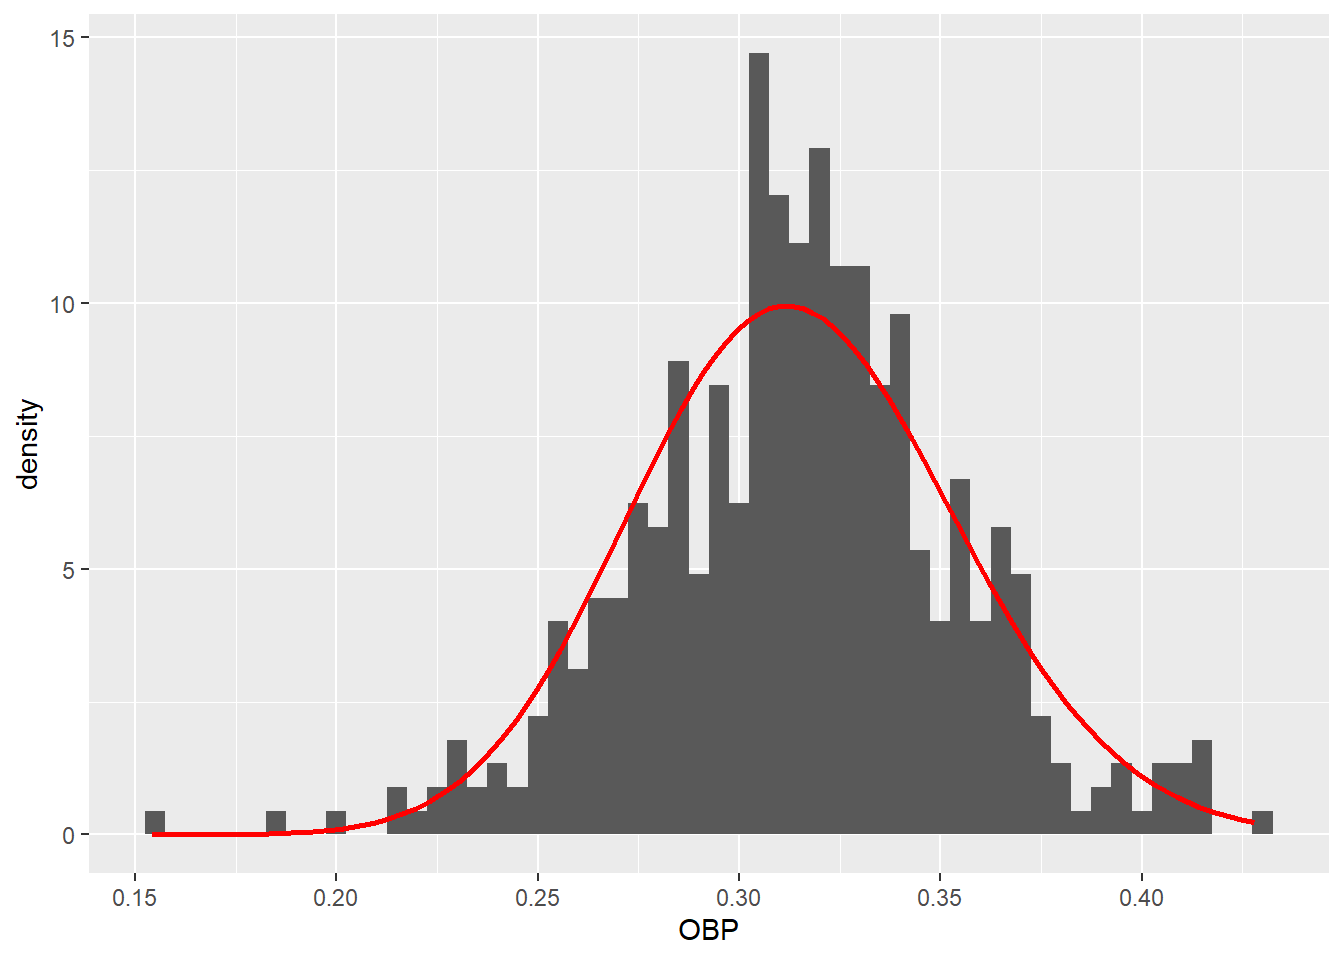
Filter out noisy data - batters with less than 100 season ABs - and use the fitdist function to fit a beta distribution to the remaining data.
# Filter out less than 100 at bats to fit model
df.grouped.100p <- df.grouped |>
    filter(ab_total > 99)

plot_obp.100p <- ggplot(df.grouped.100p, aes(x=obp)) +
  geom_histogram() +
    theme_minimal()

# Fit distribution
mass <- MASS::fitdistr(df.grouped.100p$obp, dbeta,
                    start = list(shape1 = 1, shape2 = 10))
## Warning in densfun(x, parm[1], parm[2], ...): NaNs produced

## Warning in densfun(x, parm[1], parm[2], ...): NaNs produced
alpha0 <- mass$estimate[1]
beta0 <- mass$estimate[2]

# Check fit with plot

(fit_plot <- ggplot(df.grouped.100p) +
        geom_histogram(aes(obp, y = ..density..), binwidth = .005) +
        stat_function(fun = function(x) dbeta(x, alpha0, beta0), color = 'red',
                        linewidth = 1) +
        xlab("OBP"))
## Warning: The dot-dot notation (`..density..`) was deprecated in ggplot2 3.4.0.
## ℹ Please use `after_stat(density)` instead.
## This warning is displayed once every 8 hours.
## Call `lifecycle::last_lifecycle_warnings()` to see where this warning was
## generated.

# Create predictions for all 2023 data

df.grouped.post <- df.grouped |>
    mutate(obp_est = ((num + alpha0) / (den + alpha0 + beta0))) |>
    mutate(diff = obp_est - obp)

(hist.errors <- ggplot(df.grouped.post) +
    geom_histogram(aes(diff, y = ..density..) , binwidth = .005))

# Could rerun with April and May data only and forecast rest of season
Here’s a plot of the model’s residuals.
(fit_plot)
(hist.errors)

(ggplot(df.grouped.post, aes(obp, obp_est, color = ab_total)) +
  geom_hline(yintercept = alpha0 / (alpha0 + beta0), color = "red", lty = 2) +
  geom_point() +
  geom_abline(color = "red") +
  scale_colour_gradient(trans = "log", breaks = 10 ^ (1:5)) +
  xlab("On Base Percentage - Actual") +
  ylab("On Base Percentage - Estimated"))

Keegan Johnson
HR Data Scientist
My interests include improving organizational data visibility, defining and implementing high data modeling best-practices, and finding efficiency opportunities for more advanced predictive analysis..